Waze Services

waze1I only started using Waze recently and the first day I used it for my drive home from work, I beat its estimated time by a few minutes.  And I thought “that is a fun game – to beat Waze.”  And then I thought “hang on, they know when I am speeding and that might not be a good thing!”  Then I got to thinking about what new services Waze could offer that they are not offering today.

Here are a few services  Waze already offers:

  • The obvious and main service is calculating the best route
  • Frequently traveled locations are saved for easy use – like Home and Work
  • Knowing what’s up ahead of your route based on other user input – police, accidents and traffic
  • If you connect to FB and you are meeting your friends, you can see where they are on Waze
  • As the Waze community updates the price they pay for gas, Waze shows you gas price comparisons in your area
  • Planned Drives on Waze allows you to enter a time and date that you need to arrive at a destination and Waze will let you know the best time to leave so that you will not be late
  • Waze hands-free allows you to use voice controlled commands so you can be attentive to your driving

waze2

What other services could Waze offer?

  • Using the knowledge of whether a driver is speeding or not, Waze could offer a service to text a parent or guardian when a young driver is speeding.
  • Waze could offer another service to parents/guardians of young drivers to deliver a completed route driven along with speeds.
  • Auto insurance companies are using GPS to offer insurance rates based upon actual driving; this is called usage-based insurance and Progressive Snapshot  is an example of this product (reference 1). Waze could partner with Insurance companies to offer this service.
  • Frequent routes like Home to Work and Work to Home are tracked by date and time and Waze could offer City/State planners aggregated information about the travel patterns of their city roads and freeways.

Waze is a product based on data and now that the product has a solid core use of providing efficient routes, it is easy and fun to come up with new features it can offer.  That is my opinion and a survey of one.

References:

(1) https://www.progressive.com/auto/snapshot/


Posted in Data Science, Technology | Tagged | Leave a comment

Northwestern University – M.S. in Predictive Analytics

Time to start blogging again!  I haven’t been blogging for over two years because I have been busy doing Predictive Analytics homework.  I am almost done with an M.S. degree in Predictive Analytics from Northwestern University.  This has been a great program for a number of reasons:

  • The Instructors have real world predictive analytic experience with many working for top tier companies; in most cases, the Instructors are still employed in the areas of predictive analytics and data science and teach on the side.
  • My fellow class mates come from all types of job titles and industries. The variety of skill sets in each class provide excellent exposure to learning about different industries.
  • I have gained experience programming in Python, SAS and R.
  • The program was designed to lay a solid analytics foundation with core courses and then build practical application knowledge with the elective courses.

This program has been a valuable way to spend 10 to 20 hours a week after work doing homework!!!!

Courses:

400 – Math for Modelers (Python)

401 – Statistical Analysis (R)

402 – Intro to Predictive Analytics

410 – Regression and Multi Analysis (SAS)

411 – Generalized Linear Models (SAS)

413 – Time Series and Forecasting (R)

420 – Database Systems and Data Prep (Python – Jan to Mar 2017)

422 – Practical Machine Learning (R)

450 – Marketing Analytics (R)

454 – Advanced Modeling Techniques (R)

455 – Data Visualization (R – in progress Sept to Dec 2016)

498 – Capstone Project (April to June 2017)

Time to start blogging again and the topics will become more and more slanted towards predictive analytics and data science.  Signing off – that is my opinion and a survey of one.

Posted in Analytics, Data Science, predictive analytics | 2 Comments

Nudge by Design

Nudge and flyI recently was handed a copy of the book Nudge (reference 1) from a work colleague. Even though this book was originally published in 2008 (and updated in 2009), the main theme that describes the importance of the Choice Architect is still applicable today. The Choice Architect creates an environment that helps people make better choices and decisions. The example of a nudge that has received the most attention from the book was the placement of a fake fly in the urinals at Amsterdam’s Schiphol airport. The choice to aim at the fly reduced spillage by eighty percent which resulted in cleaner restrooms and easier maintenance on the cleaning staff.

Here are examples of nudges that already exist in our every day lives that help us with choices:

  • Ever forget your ATM card in the ATM machine? That happened so much, the banks made a change that the ATM card is returned before any next step in the login occurs. The Choice Architect helped you remember your card!
  • Our cars are equipped with reminders to put on the seat belt, get gas, time for an oil change or a tire is low; cars also have options that the headlights turn on and off only when they are needed so you don’t forget to turn them off and drain the battery.
  • Gas nozzles have been created so that they only fit in the appropriate gas tanks – meaning you won’t be able to put regular gas in a diesel tank – which will help in car rental situations.
  • Birth control pills are designed to be taken one a day, even though pills 22 – 28 are placebos. This design is because it is easier to remember to take a pill a day instead of take a pill a day for three weeks, wait a week and then start again.

Nudge and keysDo you have a bad habit you need to break?  How about a nudge?  www.pleasurabletroublemakers.com has examples of innovative products that playfully provides you with options.   For example,  if you select the car key, the bike key will drop and you will need to really ask yourself if the car is the best choice for what you need to go out and do. As we go through our day to day routine, we can use a nudge to help us make sure we have made the best choice.

Listed below are the tools of a Choice Architect:

  • Defaults – there must be an option if a person makes no choice at all, and many people take the path of least resistance which will be the default.  The default should represent the normal choice or the recommended option.
  • Giving feedback – provide people feedback throughout the process so they know how they are doing and can make adjustments.  The example given in Nudge is a white ceiling paint that goes on pink so the painter can see what he has painted and areas he has missed, yet it dries white.
  • Expecting error – it should be expected that people will make errors, so the Choice Architect can anticipate the user experience and be forgiving as those errors or made or create an experience that eliminates the error all together – like forgetting your ATM card in the machine.
  • Understanding mappings – make information about various options obvious so that good decisions can be made; examples are calories on menus, credit card interest rates and mobile phone plans.
  • Structuring complex choices – as choices have more options, it is important to structure the options in a clear way.  For example, paints that come in thousand of  colors are more easily displayed in color wheels that show like colors side by side.

We are all faced with choices and decisions every day.  Those that create the choice environment can help by anticipating our error, giving real time feedback, simplifying the decision structure and by making the differences about our options obvious and easy to understand.  That is my opinion and a survey of one.

References:
(1) Thaler, R.H. & Sunstein, C.R. (2009) Nudge: improving decisions about health, wealth, and happiness.  New York, Penguin Press.


Posted in Ideas | Tagged , | 2 Comments

The Analytics Edge by MITx

edx mitxI just finished a free eleven week online course hosted through www.edX.org called The Analytics Edge offered by MITx.  The course content was essentially the same as the normal course offered by MIT along with 8-10 hours of homework each week.

The course covered a lot of information in only eleven weeks. We were taught how to use R (statistics programming language) to perform linear regression, logistic regression, trees, text analytics, clustering, visualization and then we used Solver in Excel (or Libre Office) for linear optimization and integer optimization.

A strength of the course was the real world examples and sample data that was used in the lectures, in the recitations and in the four homework assignments each week. We predicted the quality of wine, looked at the Framingham heart study, predicted Supreme Court decisions, turned tweets into knowledge, looked at sports scheduling and how eHarmony uses predictive analytics to make matches.

And the best (and hardest) part of the course was competing in a www.kaggle.com competition; it was a closed competition with only people enrolled in the class participating. We were given data from a company called Show of Hands that has had over 300,000 downloads of their mobile app and have had over 75 million votes answered on questions that see what aspects of people’s lives predict happiness. We were given training data to 4619 people on 101 different questions like: does life have a purpose? Are you generally more of an optimist or a pessimist? Would you rather be happy or right? We were also given demographic information about each person – year of birth, gender, education level, income level and political party. The dependent variable was Happy – and we had to try to predict the dependent variable Happy. This was the first time MITx worked with Kaggle and there appeared to be some challenges with how the competition was setup because when it came time for the final results to be posted, there was a huge flip flop between estimated final results and actual final results. But the value of having to work with “dirty” (meaning real world) data and having the Forums available to understand how others were approaching the analysis was extremely valuable.

MITx shared some interesting stats about the course – over 25,000 people signed up for the course. By week four, 3300 (or 13%) worked on that week’s Quick Questions (meaning the people listened to the lectures and answered the questions between the lectures) and 2400 (or 9.5%) worked on week four homework assignments. MITx commented that the level of participation in week four was higher than normal for the free Massive Open Online Course (MOOC) model.

At the end of the eleven weeks when it came time for course grading and the archiving of the course, some type of technical difficulties occurred and we had to wait an extra week to get our completion certificates. But besides the few technical glitches – the course content, the lecture videos, the homework on real world data – were excellent. The next thing is to decide which free MOOC to take next! That is my opinion and a survey of one.

Posted in Analytics | Tagged , , , , | Leave a comment

Google Fusion Tables

Making Sense of DataI was curious about Google Fusion Tables so I recently completed an online course offered by Google. The course, called Making Sense of Data, consisted of three sections: Introducing the Data Process, Answering Basic Questions with Fusion Tables and Finding Patterns and Relationships in Data. The lessons consisted of examples of how to use the tables, supplemental videos, hands on experience and a final project.

At first glance, Fusion Tables appears to be a simpler cloud based version of Excel, but once you realize what can really be done with Fusion Tables, you can start to see the potential.  Here are some major points about Google Fusion Tables:

  • When using Fusion Tables, all data is stored on Google Drive. To start a Fusion Table, you can load data from a Google spreadsheet, import from your local drive or input manually
  • You can make data public or private (see point below about privacy)
  • Since the data is stored on the cloud, you can have others collaborate on the Fusion Tables
  • You can merge data with publically available data – once you locate it on the web
  • You can publish charts, plots, maps, etc on the web
  • Cards is a cool feature of Fusion Tables where each row of data is aggregated onto one Card.  This is an example of a real estate company using Cards to display listings Fusion tables cards
  • Big advantage of putting countries or addresses in Fusion Table data and choosing a Map option will result in Google’s geocoding service calculating and placing pins on your mapFusion tables map
  • If you have privacy worries putting data on Google Drive, the Google Terms of Service says that you continue to own the intellectual property rights on any data uploaded to Google, but that Google can use what you upload in the spirit of promoting, improving services and developing new services.  This is an extreme paraphrase of the legal speak, so if you are curious about the fine print before you use Google Drive, check out the full document.

The power of Fusion Tables is in having easy to use features – like the Cards that aggregate records into an easy to publish format and in producing Maps that automatically geocodes the data and places it on a Map.  The more features that Google can create that the small business owner can do on his own without the help from web professionals, the more uptake of Fusion Tables will occur. That is my opinion and a survey of one.


Posted in Analytics | Tagged , , | Leave a comment

Spritzing – or reading really fast

I have so many things I want to read and not enough hours in the day to read them all.  I read books/magazines on a wide variety of business topics and for fun I just finished Divergent by Veronica Roth.  I’m half way through Insurgent, the second book in the trilogy and I …. just …. can’t …read …. it…. fast ….enough; it is so good!

Spritz screenSo you can imagine my excitement when I saw a new technology that will help to speed up your reading time.  The technology is called spritzing and was created through three years of research and development by Spritz Technology, Inc. (http://www.spritzinc.com/).   The first use of a spritz is on the Samsung Galaxy S5 and Galaxy Gear 2, but if you want to give it a try, go to the company’s website and see how fast you can read and still understand the words flying across the screen.

What exactly is spritzing and how does it work?

  • the slowness of traditional reading comes from the movement of the eyes where the eyes go from word to word and then sentence to sentence.  80% of the time spent reading is the movement of the eyes and the other 20% of the time is spent processing the content.
  • since the human eye can focus on about 13 characters at a time, a redicle (word created for spritzing meaning the special frame designed to show each word) shows a new word at the speed specified by the user in words per minute (WPM).
  • the eye looks for a certain point in each word – called the “Optimal Recognition Point” or ORP.  Each eye movement is called a saccade and with each new word, the eye is looking for the ORP.  Once the ORP is found, processing of the word for meaning and context happens.  When the eye encounters punctuation within a sentence or at the end of a sentence, the brain assembles all the words that have been read and processes it into a coherent thought.
  • testing has shown that retention levels using spritzing is at least as good as traditional reading.

When I tried out spritzing on the Spritz Technology website, I started out at 250 wpm and I did manage to go all the way up to 600 wpm and still understand what was flying across the screen.  I think when I tried 500 wpm, I blinked and missed a few words and had to start it over again.

I’m still old fashioned and love to read a hard cover book.  And I also read on my Kindle Fire.  But if I could finish Insurgent tonight by spritzing…. count me in!  That is my opinion and a survey of one.

Spritzp.s. Spritz Technology has created ways for companies to use their technology.  They have created SDK’s and API’s for iOS, Android and JavaScript.  And they have licensing options for integration with operating systems, applications, wearables and websites.

Posted in Technology | Leave a comment

#readinglist

I thought I had a great idea to create a #readinglist hashtag on Twitter so that I could track the books I had read and occasionally go back and leaf through the books looking for pearls of wisdom.  The ‘going back and looking part’ did not happen and so I decided to summarize important nuggets of information in my blog for easy reference.

There is no theme or link between these three books, but they happen to be the last books I read that made an impact on me in some way.

The AdvantageThe Advantage: Why Organizational Health Trumps Everything Else in Business by Patrick Lencioni (2012) – an organization is considered healthy when its management, operations, strategy and culture come together and make sense.  Lencioni states that almost all companies are smart in regards to finance, strategy, marketing and technology.  But not all companies are healthy – with healthy meaning there are minimal politics and confusion, low turn over among good employees and there are high amounts of morale and productivity.  One important aspect of healthy companies is the ability to create a sense of alignment and focus and that can be achieved by having a single top priority, or as Lencioni terms it – ‘the thematic goal’.  The thematic goal can be likened to a rallying cry and can be answered by the question , What is most important, right now?  The thematic goal must be singular or the one most important goal of the company.  The thematic goal must be temporary and be achievable within a clear window of between three and twelve months.  The thematic goal must be agreed upon by top executives and understood that it is their collective responsibility for achieving that goal.  As leaders rally around the chosen thematic goal, they take off their department hats to lead and manage and solve problems for achieving organizational success.

Creative confidenceCreative Confidence: Unleashing the Creative Potential Within Us All by Tom and David Kelley (2013) – IDEO is well known for their innovations and their successful human-centered innovation process which have led to many products that we all use on a daily basis.  The Kelley’s describe four steps to their design-driven innovation: 1) get out into the world to interact with others to put yourself in others’ shoes.  Be empathic and connect with others needs, desires and motivations to help trigger fresh ideas from a human-centered innovation perspective. 2)  Synthesize and make sense of your observations by recognizing patterns, looking for themes and connecting the dots to what you have seen and gathered. This step involves translating what was discovered in research into actionable frameworks and principles.  3) The third step is to generate many ideas with divergent options which results in the most promising ideas going into rounds of quick prototypes.  Users and stakeholders provide feedback for adaptations and iterations that result in workable solutions. 4) Implementation is the final step that will vary by product and varies by roadmap to the marketplace.
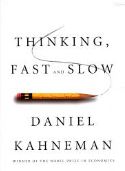
thinking fast and slowThinking, Fast and Slow by Daniel Kahneman (2011) – our mental life is made up of two systems called System 1 and System 2.  System 1 operates automatically, quickly with no effort (thinking fast) and System 2 is the conscious, reasoning side that has beliefs, makes choices and decides what to do (thinking slow).  System 1 will continuously generate suggestions for System 2 in the form of intuitions, intentions and feelings.  Once System 2 endorses information from System 1 then the impressions and intuitions turn into beliefs and impulses turn into voluntary actions.  Most of what your System 2 thinks and does starts from System 1, but System 2 can over ride and have the final say.  The purpose of explaining the mental flow process of the two systems was so I could share Kahneman’s explanation of the priming effect.  The priming effect starts with a System 1 automatic process called associative activation where an idea evokes and triggers many other ideas in a cascading effect.  A word/idea can evoke memories, emotions,  and facial expressions that happen quickly, automatically and effortlessly.  There are different types of associative links: 1) link by properties: banana –> yellow; 2) link by effect: virus –> cold; 3) link by category: football –> sport.  One form of the priming effect is that if you are already thinking about a banana, the first color to come to mind would be yellow.  Words like forgetful, bald, gray and wrinkle that are associated with the elderly have been shown to prime behavior like walking slower – even though the word old was never mentioned.  Common thoughts and gestures can also prime our thoughts and feelings with research showing that a nodding of the head gesture (Yes) results in being more accepting to the topic at hand.  Understanding the prime effect solidifies to me the importance of semantics as we interact with others and the importance of the thoughts that enter our mind throughout the day.

I thought it was going to be easy to leaf through the books I read looking at all my underlinings and asterisks and notations in the margins to quickly find the nuggets of information that I wanted to share.  But the authors had all done a great job of building concepts upon concepts that I hope I have not done an injustice by only presenting single concepts from these books.  Maybe these snippets have peaked your curiosity and have primed you to read the whole book?  That is my opinion and a survey of one.

Posted in Business | Tagged , , | Leave a comment

Decision Making and Organizational Health

Why have I not been blogging so much in 2013, you ask?  Because I was facilitating decision making workshops – and was pleasantly surprised by what happened at the workshops…….

healthMuch of my free time in 2013 was spent preparing for two-twelve week workshops that were attended by 40 executives in total.  The workshop was based on The Art of Critical Decision Making course by Michael Roberto (reference 1).  The format of the workshop was that two chapters per week were covered and the attendees were required to have already listened to the material and to be prepared to discuss the topics in a one hour collaborative session.

The original intent of the workshops was to create an agreed upon decision making process so that consensus on projects could be attained resulting in a more streamlined project management process.  The pleasant surprise was how much excitement and buzz that came from the participants.  Executives would stop me in the hall and say how much they were enjoying the workshops, how they were learning perspectives from those in other departments, how they liked being heard, how the workshop could positively affect culture, how it could help build consensus and eliminate silos.   This was good stuff!

Then part way through the second set of workshops, I picked up the book The Advantage: Why Organizational Health Trumps Everything Else in Business by Patrick Lencioni (reference 2).  And I realized all of the positive feedback coming from the workshops was actually contributing to organizational health.  More good stuff!

As it turns out, there are many parallels between good decision making practices and habits of companies with high organizational health.  Listed below are some of the commonalities:

  • A company with high organizational health has team members that are open to one another and are willing to passionately debate issues so clear decisions and commitment can be achieved.
  • A good decision making process fosters constructive debate where contrarian analysis and counter arguments are encouraged so that all perspectives can be discussed.
  • High organizational health companies do not rely on ‘advocacy’ where people state their case and make their point, but they promote ‘inquiry’ where people are inquisitive and ask questions to seek understanding about someone’s statement of advocacy.
  • Good decision making processes will support people asking disconfirming questions about conclusions, will expect multiple hypotheses, will promote devil advocates to poke holes in suggestions and will look for diversity in the group so that many perspectives can be heard.
  • Organizationally healthy companies have trust among the employees so that it is understood that conflict is nothing more than the pursuit of the truth or an attempt to find the best answer.
  • Strong decision making processes support the idea that conflict enhances the quality of the choices that are made.  Cognitive conflict is task oriented and debate about issues and ideas; affective conflict is emotional and personal and must be avoided.

I wish I could say I knew all along that the decision making workshops would end up positively affecting organizational health – but I didn’t.  I have to believe if you keep doing the right things for the right reasons, things will fall into place.  And that is my opinion and a survey of one.

References:
(1) Lencioni, P. (2012). The advantage: why organizational health trumps everything else in business. Jossey-Bass, San Francisco, CA.
(2) Roberto, M.A., Art of critical decision making, course found at www.thegreatcourses.com

Posted in Business | Tagged , | Leave a comment

iGoogle to Sunset

iGoogle users were given 16 months to prepare for the retirement of the popular web portal and now the final date of 1 November 2013 is right around the corner (reference 1).  Google has even added a daily notice to remind users that the end is near.iGoogle
For those of you that have not been iGoogle users, the web portal allowed a user to add his/her own favorite gadgets to create a mashup or a homepage that reflected one’s web preferences. Example of available gadgets were weather, horoscope, Google finance with customized stock tickers, Gmail, sport scores, news feeds, Google calendar, daily jokes, daily recipes….and the list goes on and on.iGoogle sample
With a reportedly 15 million iGoogle users, why would Google stop offering such a service?  This was a strategic move announced in 2012 by Google’s Michael Eichner with a goal to narrow their product offerings to allow them to focus and avoid trying to do too much and get spread too thin; Google has combined or closed over 30 products (reference 2).

Typically when a company sunsets a product, the planned obsolescence puts the replacement product right up front for everyone to move towards, but this has not happened with iGoogle. And because of that void, there have been plenty of other companies jumping on the iGoogle replacement with products like igHome, My Yahoo getting a face lift, Symbaloo and Startific as examples.  15 million users may be a drop in a bucket to a company like Google, but that number is attracting a lot of iGoogle wanna-bees.

I still have twenty-four days to find my iGoogle replacement, but I’m not real excited about replacing my already organized and already setup, trusty old iGoogle.  That is my opinion and a survey of one.

References:
(1)   http://igoogledeveloper.blogspot.com/2012/07/update-on-igoogle.html
(2)   http://googleblog.blogspot.com/2012/07/spring-cleaning-in-summer.html

Posted in Technology | Tagged , | 1 Comment

4D Printing

4D printingI have been a huge proponent of the advances of 3D printing and have blogged about it on three separate occasions in 2012.  And now I am equally excited about the initial stages of 4D printing.  The fourth dimension is defined as self assembly over time where the material is able to change shape in response to either movement or by the introduction of an environmental factor like water, air or temperature change (reference 1).

The MIT Self Assembly lab is working with partners Stratasys and Autodesk to lead the smart-assembly revolution.  Autodesk has created software called Project Cyborg that allows for simulation on how and when materials fold on both a nano and macro scale (reference 2).  The smart materials are printed by Stratasys’ Connex multi-material 3D printing with the added capability of transformation from one shape to another; this functionality is available right off the printer (reference 3).

Skylar Tibbits of MIT described in his Ted talk that the goal of 4D printing is to create dynamic systems that can respond with ease and agility to changing conditions (reference 4).  Tibbits gave an example of water pipes that are made of programmable materials that can build and adapt themselves to change diameter as capacity and flow rates increase; 4D printing will provide a radical shift from the static and rigid structures in use today.

4D printing in just in its infancy, and I’m excited to see where creative minds take this new technology.  Imagine unboxing a product from the store and it self assembles – no instructions in five languages needed!  That is my opinion and a survey of one.

References:
1) http://www.sjet.us/MIT_4D%20PRINTING.html
2) http://www.autodeskresearch.com/projects/cyborg
3) http://www.stratasys.com/industries/education/4d-printing-project
4) http://www.ted.com/talks/skylar_tibbits_the_emergence_of_4d_printing.html

Posted in Technology | Tagged , | Leave a comment